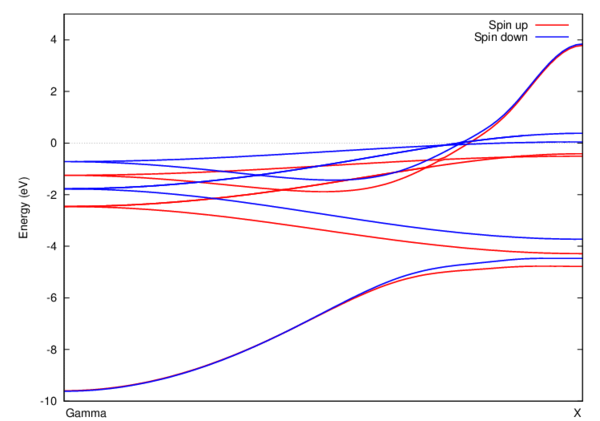
Band structure of Ni: Difference between revisions
From phys824
Jump to navigationJump to search
| Line 3: | Line 3: | ||
* Save two files below as *.py files. | * Save two files below as *.py files. | ||
=== | ===ni_lcap.py=== | ||
<pre> | <pre> | ||
Revision as of 13:03, 9 November 2014
Input files
- Save two files below as *.py files.
ni_lcap.py
from gpaw import GPAW, FermiDirac
from ase import Atoms
from ase.io import read, write
from gpaw import GPAW, PoissonSolver, MixerSum
from ase.structure import bulk

# -------------------------------------------------------------
# Bulk configuration
# -------------------------------------------------------------

a = 3.5249
atoms = bulk('Ni', 'fcc', a=a)
atoms.center()

write('system.traj', atoms)

for a in atoms:
    if a.symbol == 'Ni':
        a.magmom = 0.6

# Make self-consistent calculation and save results
calc = GPAW(h=0.18,
            mode='lcao',
            xc='PBE',
            basis='dzp',
            kpts=(8,8,8),
            occupations=FermiDirac(width=0.05, maxiter=2000),
            mixer=MixerSum(beta=0.010, nmaxold=8, weight=100.0),
            poissonsolver=PoissonSolver(eps=1e-12),
            txt='band_sc.txt')

atoms.set_calculator(calc)
atoms.get_potential_energy()
calc.write('band_sc.gpw')


# Calculate band structure along Gamma-X

from ase.dft.kpoints import ibz_points, get_bandpath
points = ibz_points['fcc']
G = points['Gamma']
X = points['X']
kpts, x, X = get_bandpath([G, X], atoms.cell, 80)

calc = GPAW('band_sc.gpw',
            mode='lcao',
            xc='PBE',
            basis='dzp',
            kpts=kpts,
            txt='band_harris.txt',
            fixdensity=True,
            parallel={'domain': 1},
            usesymm=None,
            convergence={'bands': 'all'})

if calc.input_parameters['mode'] == 'lcao':
    calc.scf.reset()

calc.get_potential_energy()
ef = calc.get_fermi_level()
calc.write('band_harris.gpw')

# Extract eigenenergies into a file for plotting with some external package

import numpy as np

calc = GPAW('band_harris', txt=None)
eps_skn = np.array([[calc.get_eigenvalues(k,s)
                     for k in range(80)]
                    for s in range(2)]) - 10.75103

for n in range(10):
    for k in range(80):
        print k, eps_skn[0, k, n], eps_skn[1, k, n]
    print
find_bands.py
from ase.lattice import bulk
from gpaw import GPAW

calc = GPAW('band_harris', txt=None)
import numpy as np

eps_skn = np.array([[calc.get_eigenvalues(k,s)
                     for k in range(80)]
                    for s in range(2)]) - 10.75103

for n in range(10):
    for k in range(80):
        print k, eps_skn[0, k, n], eps_skn[1, k, n]
    print
Run jobs on ulam
- Run band structure calculations in parallel:
mpirun -np 8 gpaw-python_openmpi your_gpaw_program.py
- Run extraction of energy eigenvalues for plotting in serial:
python find_bands.py > result.dat
Plot the results
- If your jobs are successful, you should be able to reproduce this figure (using gnuplot on Mills or transfer data to your Windows PC via sftp and use Origin):
gnuplot> plot "result.dat" using 1:2 with lines title "Spin up", "result.dat" using 1:3 with lines title "Spin down"
 |